Visual Narratives: A Collection of Infographics
A structured exploration of iconography, layout, and typographic clarity through infographic design.
Why Infographics Matter
Infographics turn complex information into clear, engaging visual stories. Whether you’re communicating research findings, performance metrics, or public‑facing data, my role is to translate your content into visuals that are easy to understand and memorable to your audience. Below is a selection of infographic work that highlights my approach to clarity, structure, and visual storytelling.

School Assignment – Infographic Icons & Layout
A foundational infographic project focused on icon creation, typographic hierarchy, and visual storytelling.
As a follow up for this animated infographic was developed:
Canada Soccer – Survey Findings (2018)
Visualizing key survey insights for Canada Soccer through a clean, data‑driven infographic series.
Client: Canada Soccer-Survey Findings

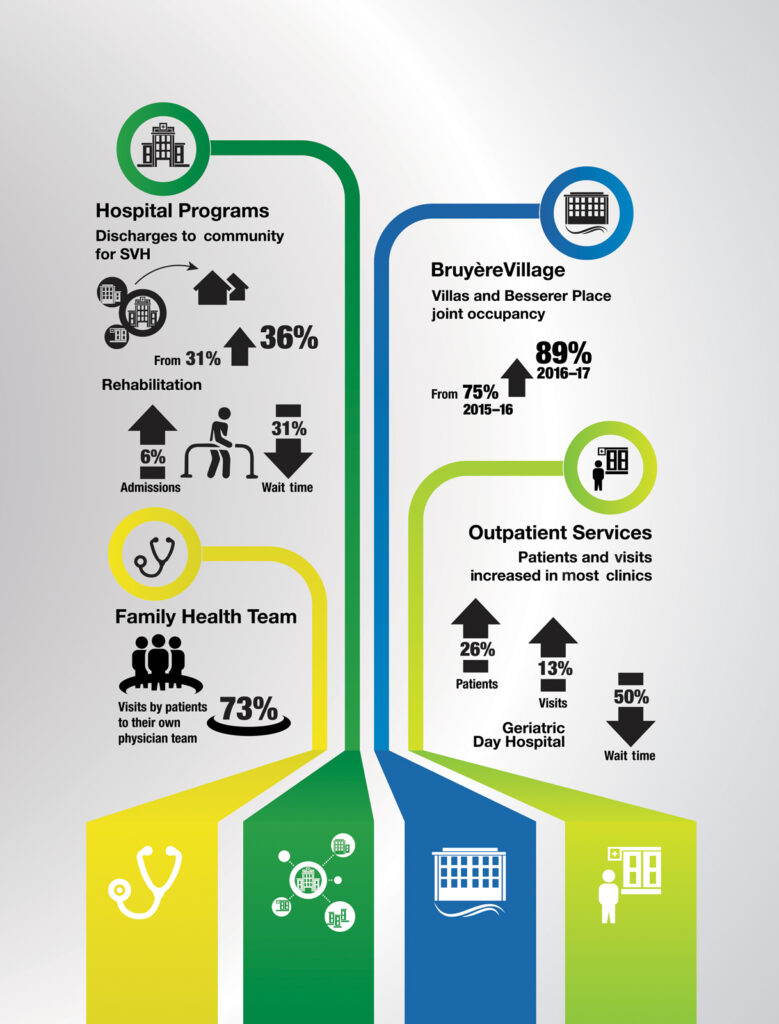
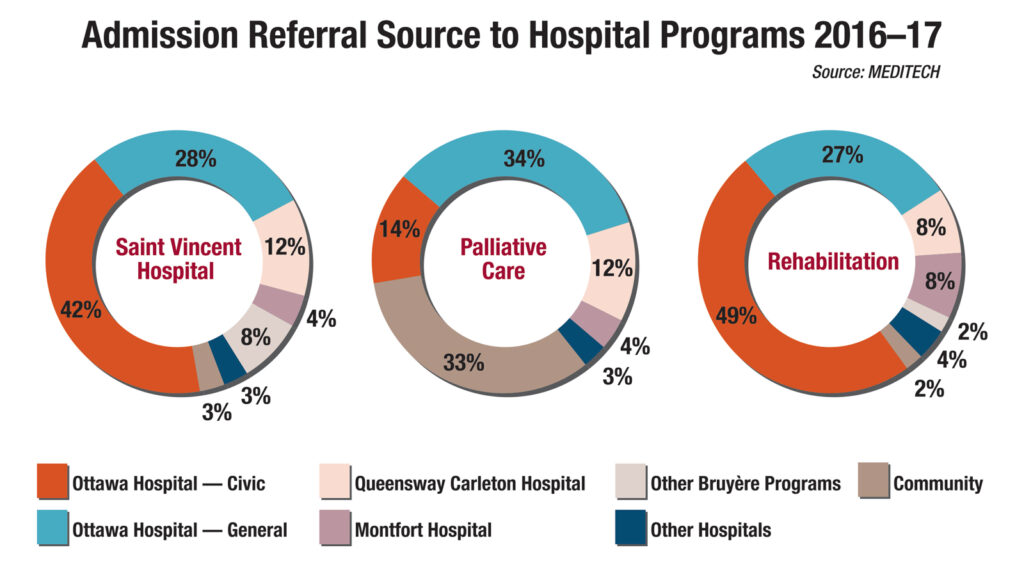
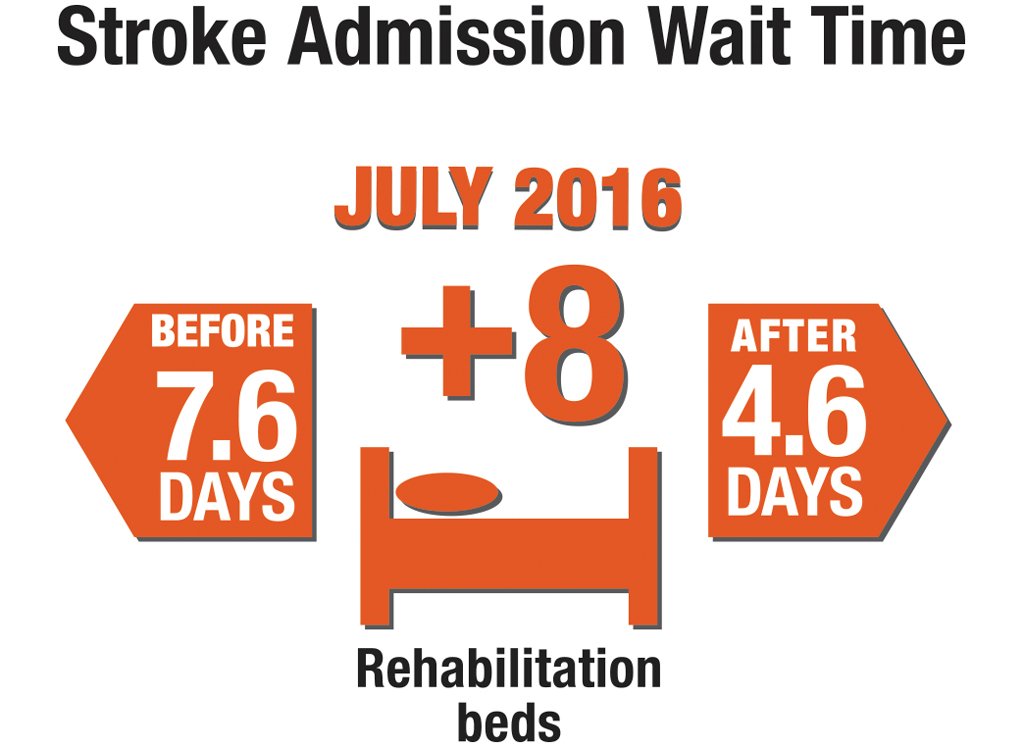
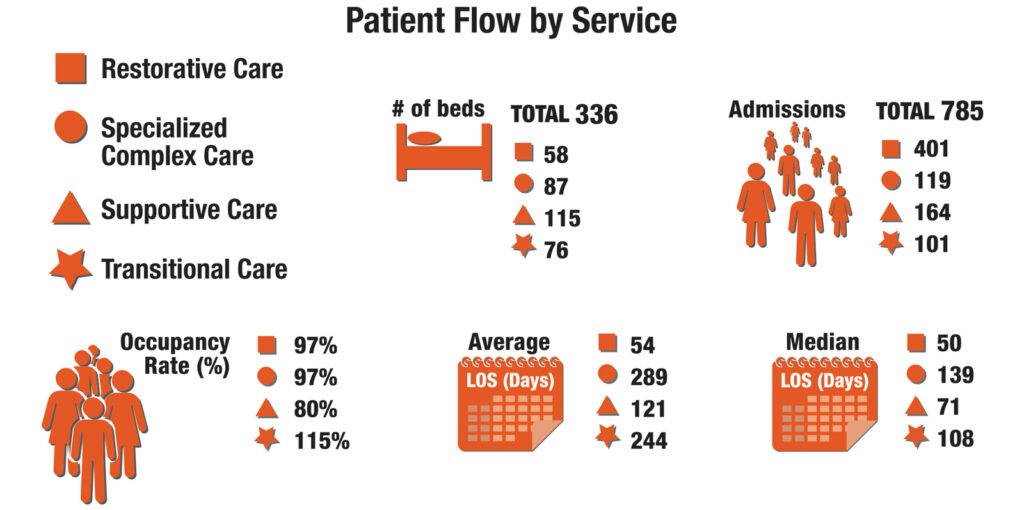
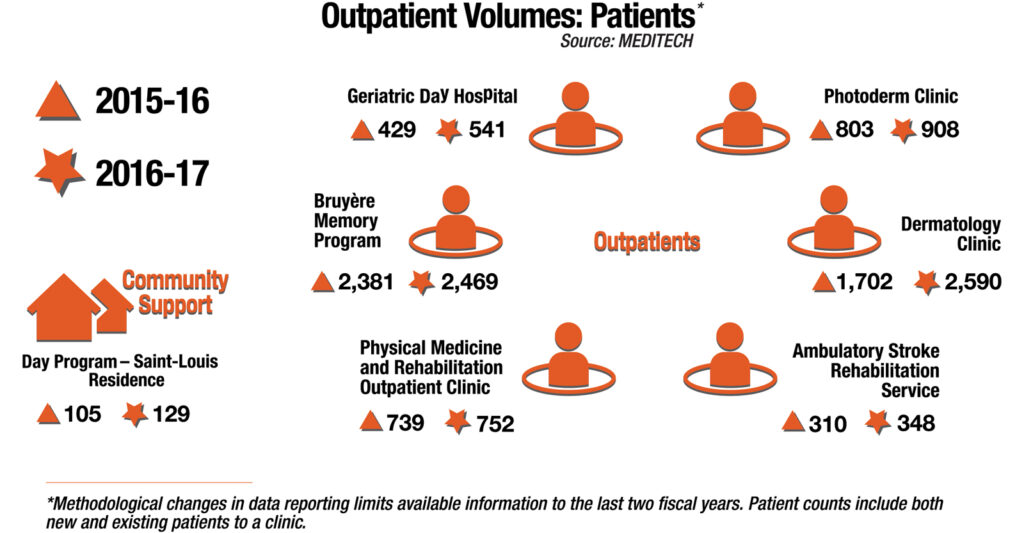
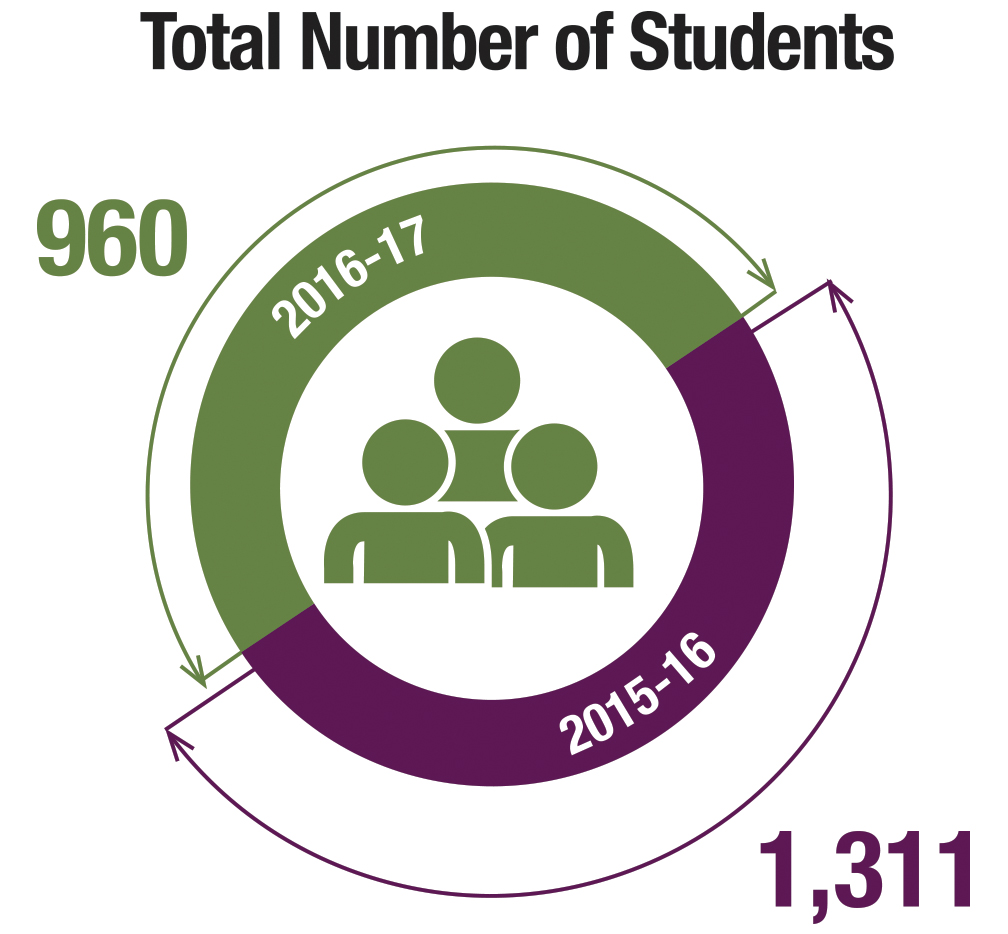
Bruyère Balance Scorecard (2016–17)
Transforming detailed hospital performance metrics into approachable, public‑facing visual summaries.

Client: Bruyère Balance Scorecard 2016-17
These infographics were created for this report, and the main challenge was translating this serious hospital data into some imagery that could be more available for the general public. To see these examples as part of the document visit this page Bruyère Balance Scorecard 2016-17.